Website Analytics Monitoring in Bonita Springs, Florida — Understand What Your Website Is Actually Doing
Most business owners have no idea what’s happening on their website. Visitors come, but where from? Pages are viewed, but which ones convert? Money is spent on ads or SEO, but which channel actually generates leads? Analytics monitoring answers these questions. We set up comprehensive tracking, monitor your website performance continuously, and deliver quarterly reports with actionable insights. You’ll know exactly what’s working, what’s not, and where to invest your marketing budget for maximum ROI.
Your You’re Spending Money on Marketing But Don’t Know If It’s Working
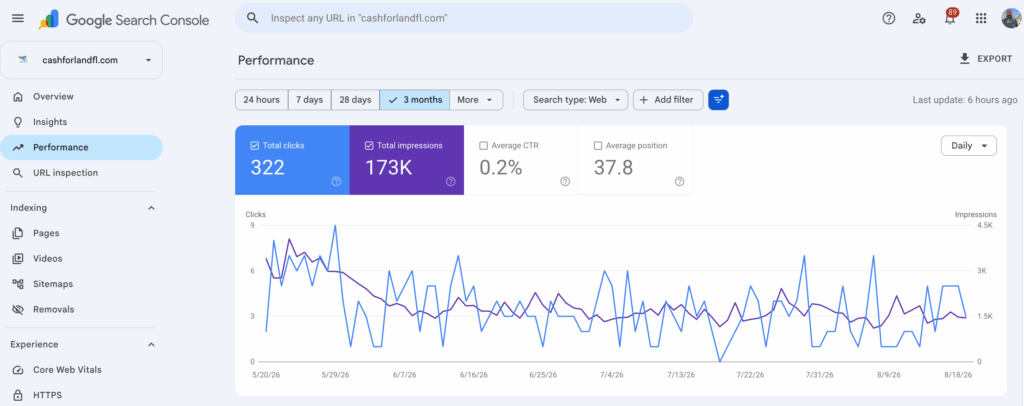
Thousands of businesses invest in websites, ads, and SEO without understanding the actual return. You can see website traffic, but that’s just a number. What really matters: where does the traffic come from? Which pages convert? What’s your cost per lead? Which marketing channels actually generate revenue? Without analytics monitoring, you’re flying blind. With it, you know exactly which strategies work and which ones are wasting money. Analytics monitoring transforms guesswork into data-driven decisions that increase leads and revenue.
Your Marketing Investment Is Invisible Without Proper Analytics
You’re probably spending hundreds or thousands monthly on your website, ads, or SEO. But can you answer these questions: How many people visit your site? Where do they come from? Which pages do they look at? Which pages convert visitors into leads? What’s your actual cost per lead? Which marketing channel generates the most qualified leads? If you can’t answer these questions confidently, you’re making marketing decisions blind. Analytics monitoring gives you the visibility you need to optimize spending and maximize ROI.
Clear signs your website needs professional analytics monitoring:
You have no idea where your website traffic comes from or which channels actually generate leads
You use Google Analytics but don’t understand it, or you’re not tracking conversions properly
You spend money on ads or SEO but can’t prove it’s generating ROI—you’re guessing at results
You don’t know which pages convert best, where visitors drop off, or why people aren’t calling
You have no regular reports or insights—nobody’s analyzing your data to find opportunities
You can’t make data-driven marketing decisions because you don’t have the data organized and explained
We Quarterly Reports Turn Website Data Into Actionable Strategy
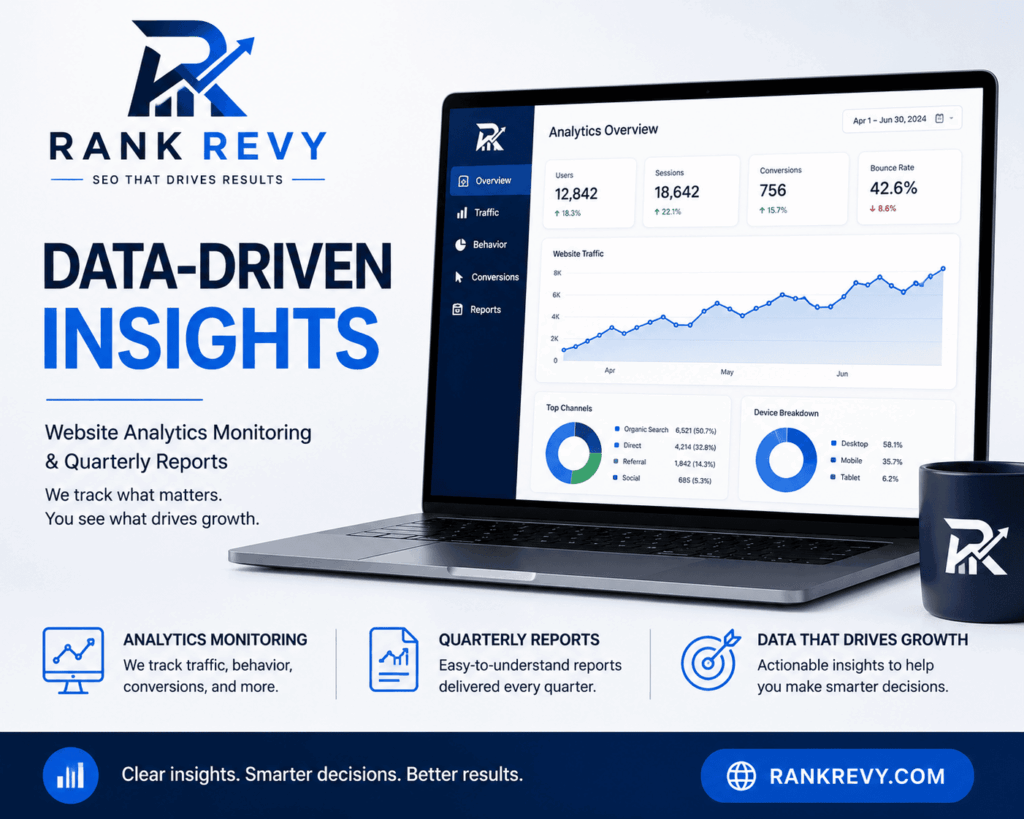
Analytics monitoring isn’t just dashboards and numbers—it’s quarterly reports that explain what the data means for your business. What’s working? What’s not? Where should you invest next? Our quarterly reports answer these questions with specific recommendations that increase leads and conversions. You’ll make marketing decisions based on facts, not hunches.
Our Analytics Monitoring Keeps You Informed With Quarterly Performance Reports
What’s Included in Our Analytics Monitoring Service:
Comprehensive Analytics Setup
We properly configure Google Analytics 4, conversion tracking, goal setup, event tracking, and custom dashboards. Most businesses have GA installed but configured wrong. We make sure you’re capturing actual business metrics.
Continuous Monitoring & Optimization
We monitor your website performance 24/7. Tracking traffic sources, user behavior, conversion rates, page performance. If something changes (good or bad), we catch it immediately.
Quarterly Comprehensive Reports
Every quarter, you receive a detailed report explaining website performance, traffic trends, conversion data, lead generation metrics, and competitive insights. Written for business owners, not data analysts—clear, actionable, understandable.
Actionable Insights & Recommendations
We don’t just show you data—we interpret it and recommend actions. “Traffic is up 20% but conversions are down. Here’s why and what to fix.” “This ad channel costs 3x more per lead than this one. Shift budget here.”
Lead Generation & Conversion Tracking
We track which pages, campaigns, and channels actually generate qualified leads. Not just clicks—actual business results. Know your cost per lead, lead quality by source, and which marketing investments generate ROI.
AI-Powered Pattern Recognition
Our monitoring includes AI analysis that spots patterns humans miss. Behavioral trends, seasonal changes, growth opportunities. AI surfaces insights you’d never see manually reviewing data.
Your Quarterly Analytics Reports Explained
Each Quarterly Report Includes:
Executive Summary
One-page summary of key metrics: traffic trends, conversion changes, lead generation results, top opportunities.
Traffic Analysis
Where visitors come from (organic, paid, direct, referral, etc.). Which channels drive the most traffic. Which channels convert best. How traffic compares to last quarter.
Conversion Performance
Which pages convert, which don’t, and why. Conversion rate by source. Bounce rate analysis. Pages where visitors drop off. Optimization opportunities.
Lead Generation Insights
Cost per lead by channel. Lead quality by source. Which marketing efforts actually generate business. ROI of website and marketing spend.
Competitive Insights
How you compare to competitor visibility (when applicable). Market trends in your industry. Seasonal patterns and opportunities.
Actionable Recommendations
Specific recommendations based on data. Which channels to invest more in. Which pages to optimize. Budget reallocation suggestions. Quick wins and long-term strategies.
In most cases, these reports will be created in interactive video reporting.
Serving Bonita Springs, Florida Businesses and Throughout Florida
We provide consistent website monitoring for local businesses throughout Florida, wherever your customers are searching online.
-
Contractor Websites & Local SEO for Port Charlotte, Florida | Rank Revy
-
Contractor Websites & Local SEO for Estero, Florida | Rank Revy
-
Contractor Websites & Local SEO for Cape Coral, Florida | Rank Revy
-
Contractor Websites & Local SEO for Fort Myers, Florida | Rank Revy
-
Contractor Websites & Local SEO for Naples, Florida | Rank Revy
-
SEO & Web Developer Experts in Florida
Top FAQs for Analytics Monitoring
Why quarterly reports instead of monthly? Isn’t monthly better?
Monthly reports create noise—one bad month doesn’t mean strategy failure, and one good month doesn’t mean success. Quarterly reports show real trends and patterns. Three months of data reveals what’s actually working vs. statistical fluctuation. Quarterly cadence also gives you time to implement recommendations before the next report. That said, we monitor continuously—if something goes wrong, we alert you immediately. Quarterly reports are the summary strategy meeting; continuous monitoring is the day-to-day oversight.
What if my analytics are currently a mess? Do I need to start over?
We can work with your existing data or start fresh, depending on your situation. If you already have Google Analytics, we audit it, fix configuration issues, and backfill missing data if possible. If you’re starting from scratch, we set everything up properly from day one. Either way, your first quarterly report will have a baseline—then we measure improvement from there.
How do quarterly reports help increase leads and conversions?
Quarterly reports identify exactly where your leads come from and which strategies work best. For example, you might discover that organic traffic converts at 3%, but paid traffic converts at 1%—suggesting you should shift budget to SEO. Or you learn that visitors from channel A take 2 days to convert, but visitors from channel B convert in 30 minutes. Armed with this data, you make smarter decisions. Recommendations in each report are specifically designed to increase leads and revenue.
Can analytics monitoring help with SEO and AI search visibility?
Absolutely. Analytics show which keywords drive traffic and which pages rank well. This informs SEO strategy. Additionally, analytics track how users interact with content—dwell time, scroll depth, engagement. This data helps optimize for AI search engines (AEO), which prioritize content that engages users. We use analytics insights to improve both traditional SEO rankings and AI search visibility.
How much does analytics monitoring cost?
Analytics monitoring typically starts at $299-$599/month depending on website complexity and reporting depth. Quarterly reports are included. Think about it this way: if analytics help you shift $5,000 of marketing budget from a channel that wastes money to one that generates ROI, you’ve paid for a year of monitoring in one quarter. Analytics monitoring is an investment that typically pays for itself many times over through smarter marketing decisions. With Rank Revy, this is included in your monthly investment!
Check out all of our Website Services including Website Management and Website Rebuild!
Let’s Get Your Website Data Working For You
Tell us about your website and current analytics situation. We’ll show you what we’d track, how quarterly reports would help your business, and what opportunities your current data is hiding.
Free Analytics Audit & Consultation
Free Website Audit